
Introduction
When looking at a trading chart, one of the first settings traders encounter is the timeframe. Changing it can transform the appearance of the chart in an instant, even though the underlying market remains exactly the same.
Understanding how timeframes work is an essential part of technical analysis. The selected timeframe determines how price movements are displayed and influences how traders interpret trends, market structure, and price action.
In this lesson, you will learn what trading timeframes are, how they affect chart analysis, and the importance of selecting an appropriate timeframe.
What is a trading timeframe?
A trading timeframe defines the amount of time represented by each candlestick, bar, or data point on a chart.
For example:
- 1-minute timeframe: Each candlestick represents one minute of price activity
- 1-hour timeframe: Each candlestick represents one hour of price activity
- daily timeframe: Each candlestick represents one full trading day
Although the market itself does not change, the way price movement is displayed changes depending on the timeframe selected.
This allows traders to analyze the same market from different perspectives without changing the underlying price data.
How timeframes affect charts
One of the most important concepts in technical analysis is that changing the timeframe changes the appearance of the chart, not the market itself.
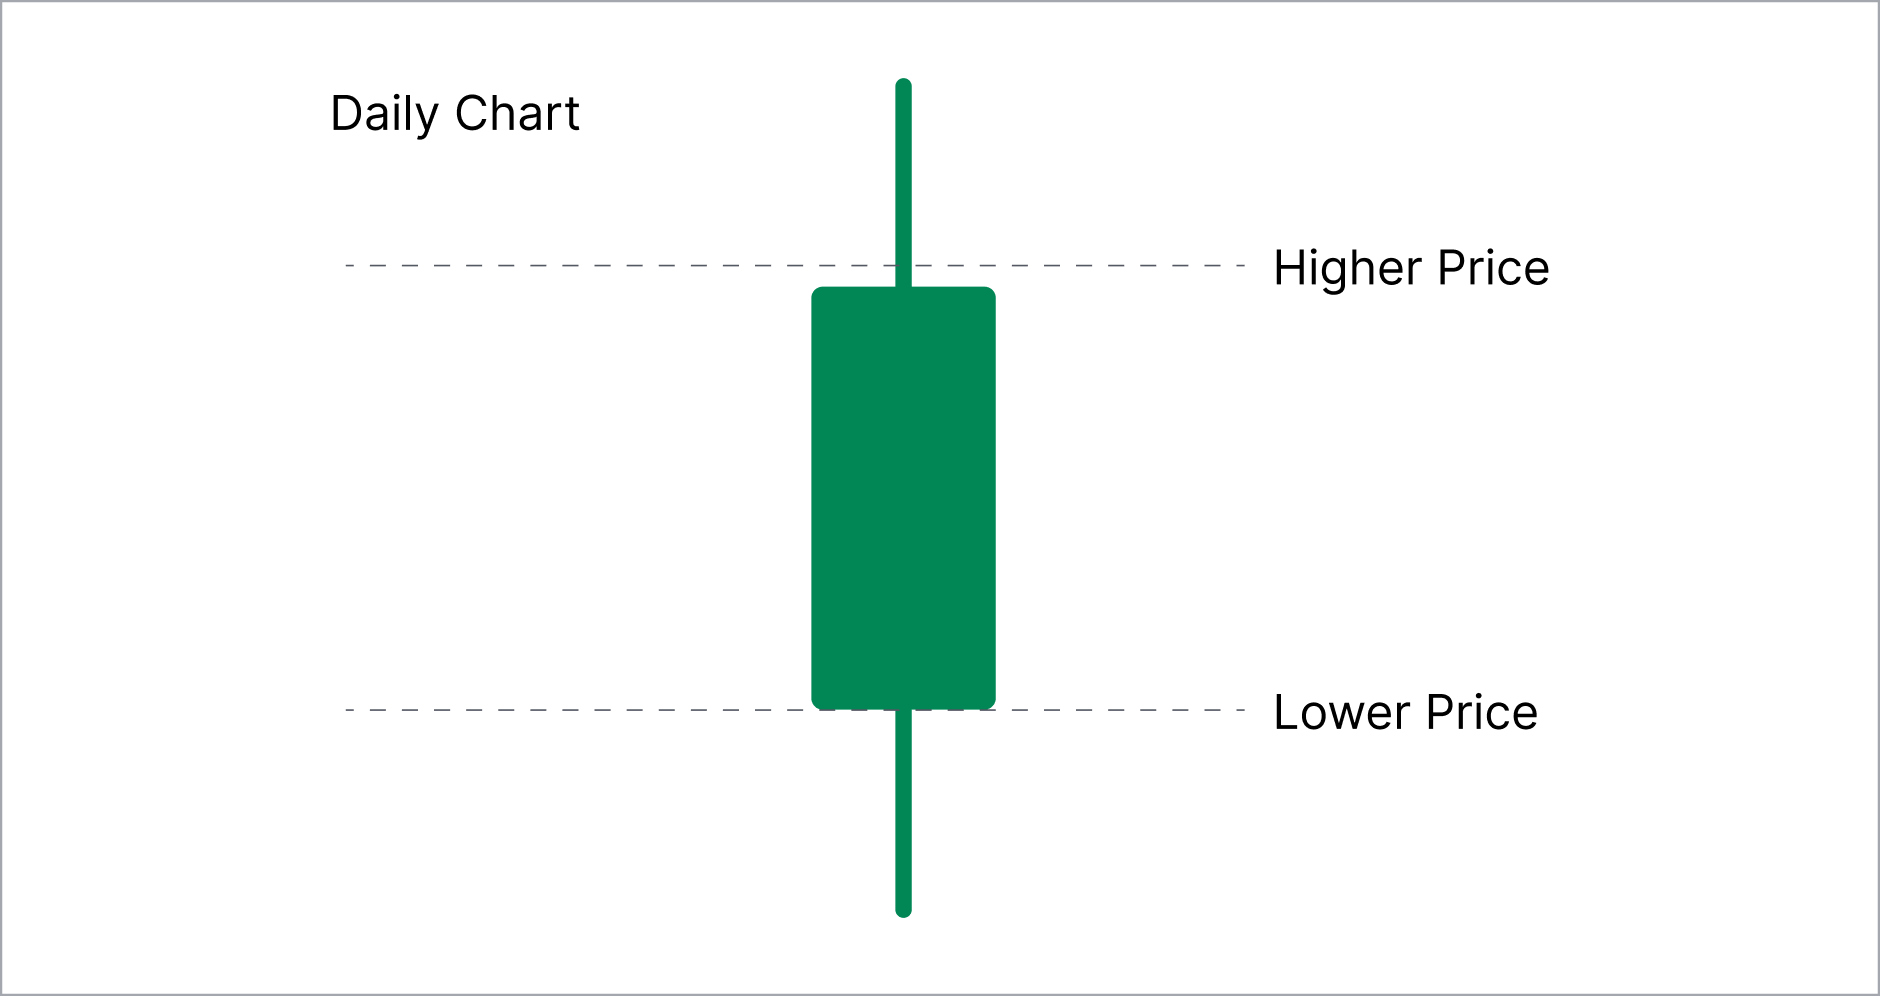
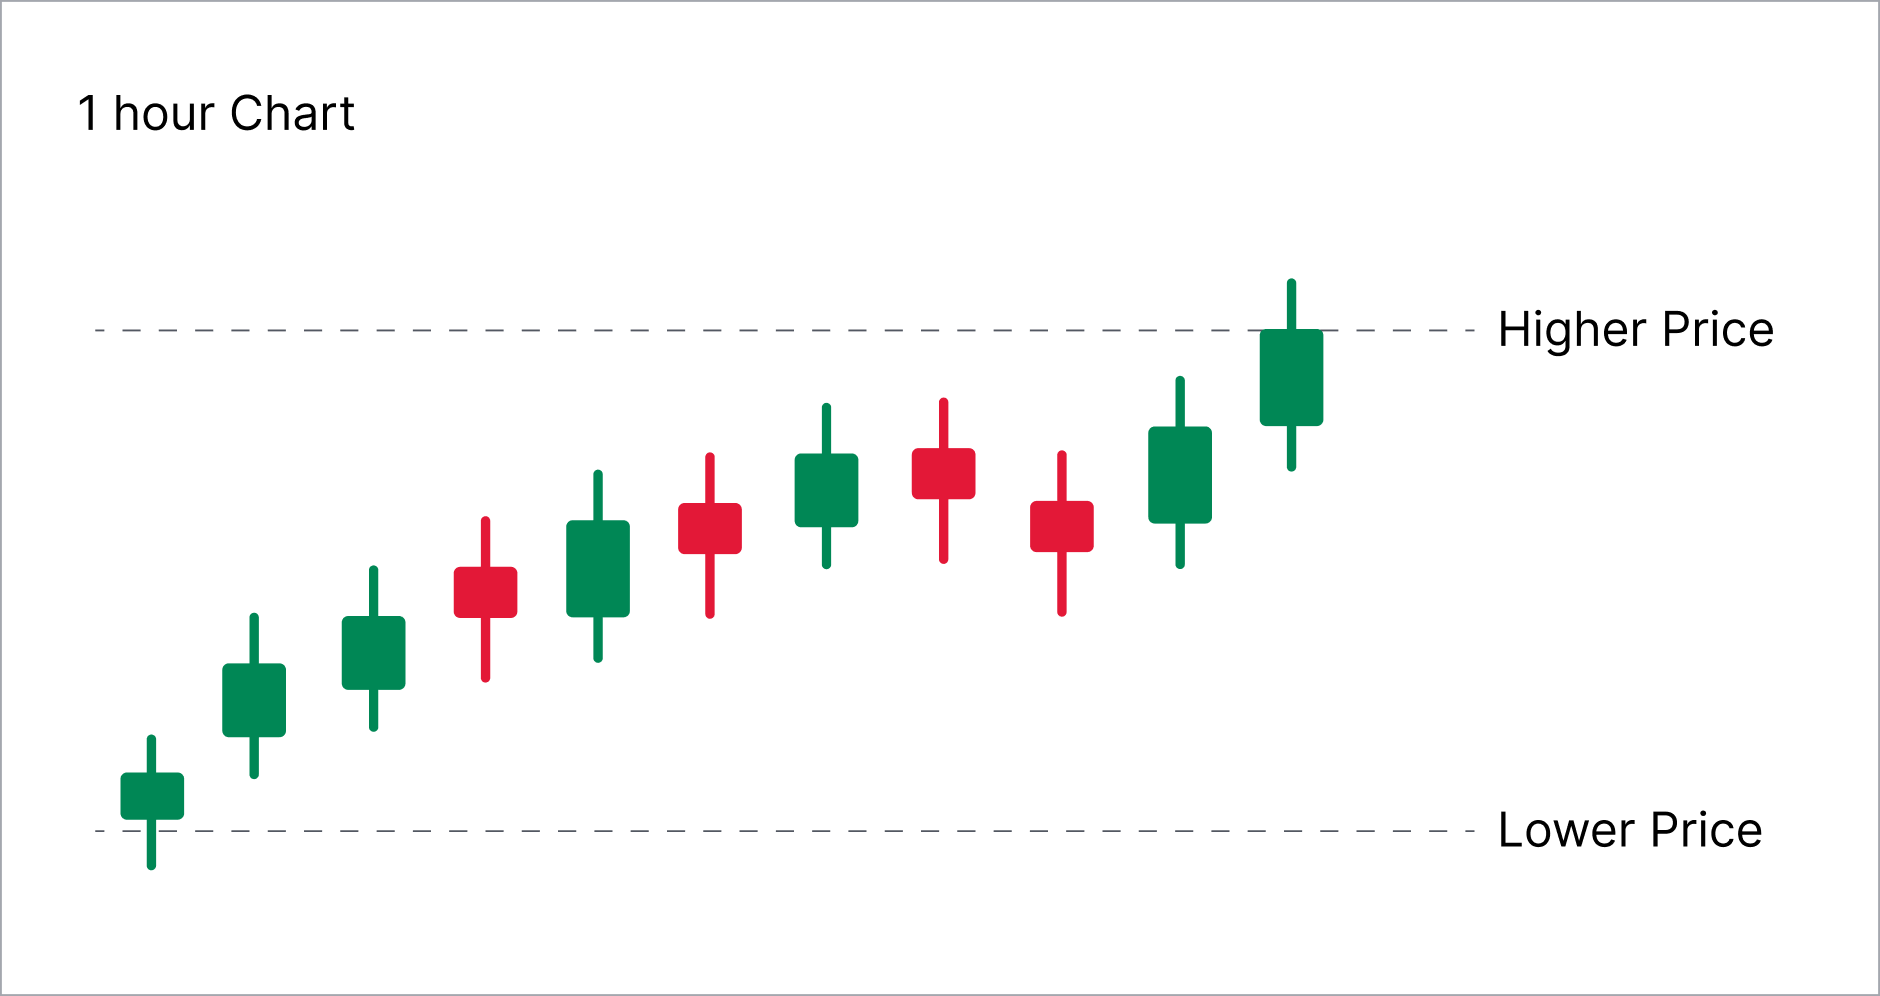
Imagine EUR/USD rises steadily throughout an entire trading day.
- On a daily chart, the movement may appear as a single bullish candlestick.
- On a one-hour chart, the same movement would be divided into multiple candlesticks, revealing the smaller price swings that occurred throughout the day.
- On a five-minute chart, the price movement would appear even more detailed, showing many short-term fluctuations that are not visible on higher timeframes.
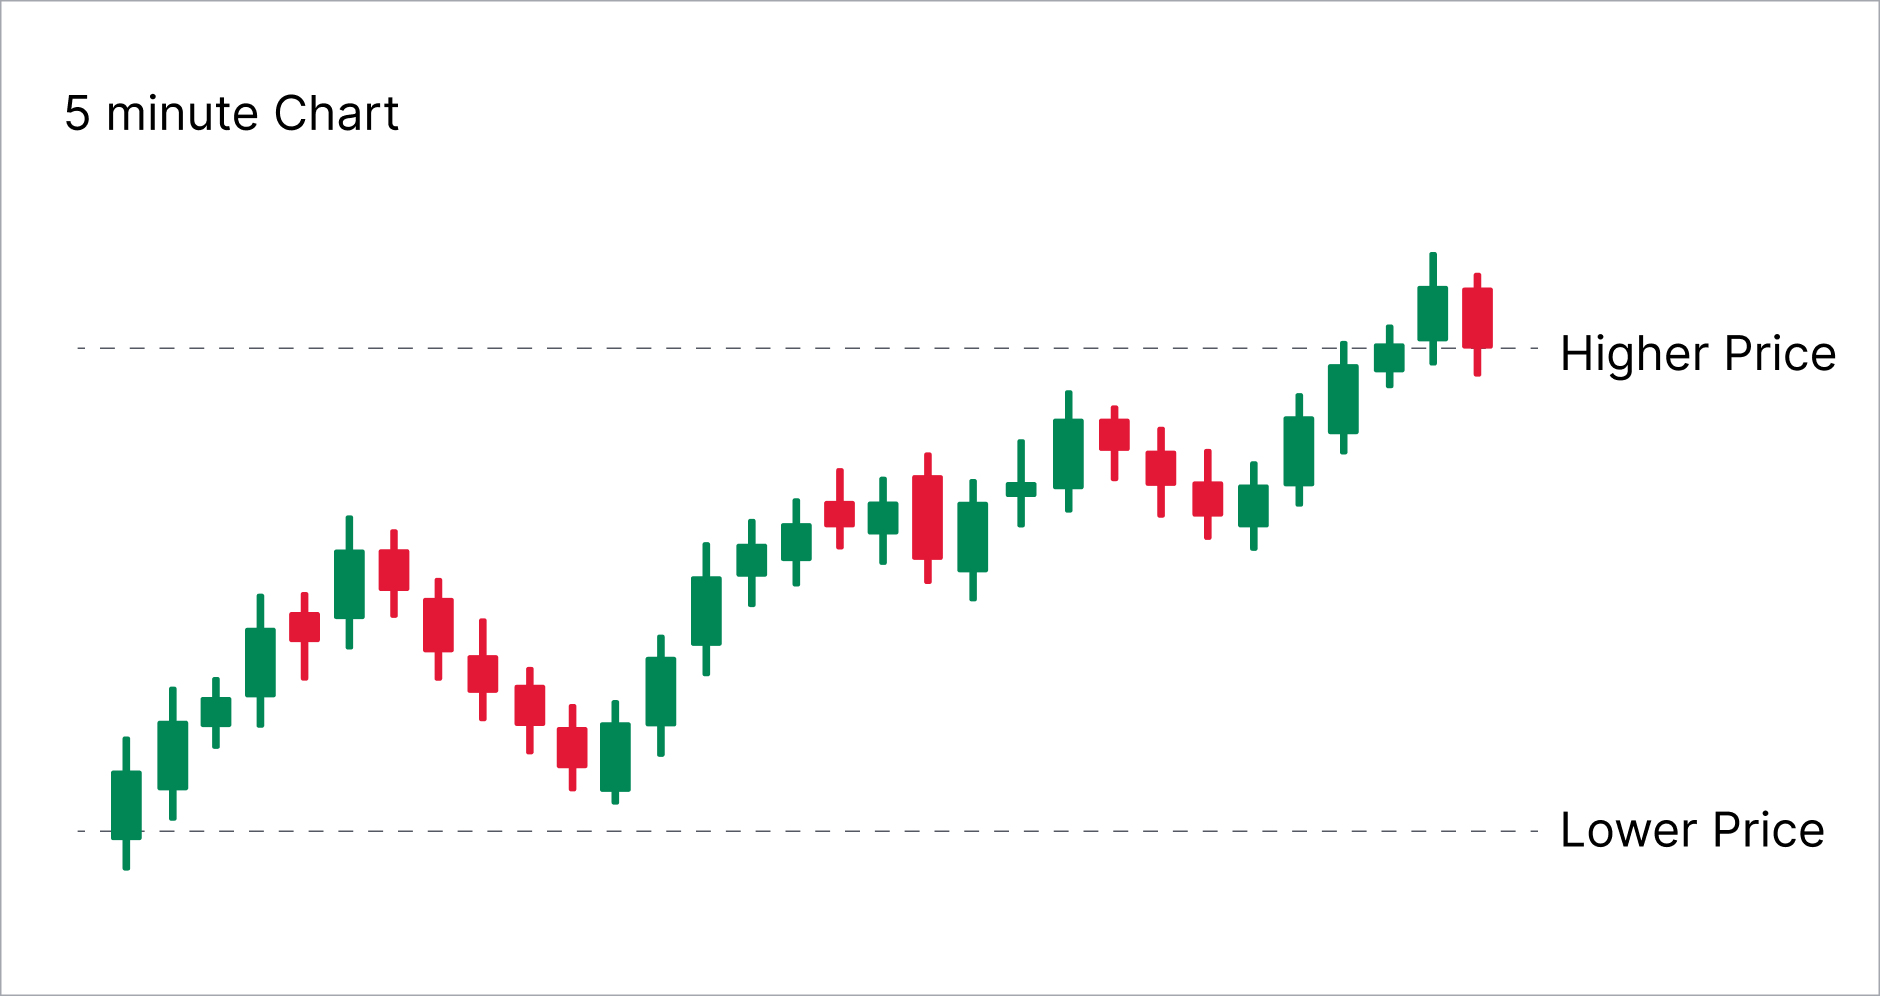
Each chart represents the same underlying price movement, but with a different level of detail. This is why traders often choose different timeframes depending on what they want to analyze.
Common trading timeframes
Most trading platforms offer a wide range of timeframes, from one minute to one month or longer. Some of the most commonly used include:
|
Timeframe: |
Commonly used for: |
|---|---|
|
1 minute |
Viewing very short-term price movements |
|
5-15 minutes |
Monitoring intraday price movements |
|
1 hour |
Analyzing short to medium-term price movements |
|
4 hours |
Identifying broader market structure |
|
Daily |
Assessing overall market direction |
|
Weekly |
Observing longer-term market trends |
These examples illustrate how traders can view the same market over different periods. They should not be interpreted as recommendations, as the most appropriate timeframe depends on the trader’s objectives and the type of analysis being performed.
Choosing a trading timeframe
There is no universally “correct” trading timeframe. The most appropriate choice depends on several factors, such as:
- Trader’s objectives
- Length of time positions are typically held
- Level of price detail required
- Amount of time available to monitor the markets
For example, traders looking to monitor short-term price movements may choose smaller timeframes, while those focusing on broader, long-term market direction may prefer bigger timeframes.
Rather than searching for the best timeframe, traders should aim to select one that supports their trading approach and provides the level of detail needed for their analysis.
Common mistakes when using timeframes
Understanding how to use timeframes takes practice, and beginners often encounter similar challenges when analyzing charts.
Frequently switching between timeframes
Constantly changing between timeframes can make price movements appear inconsistent and may lead to confusion during analysis. Maintaining a consistent approach often makes charts easier to interpret.
Assuming lower timeframes are more accurate
Lower timeframes display more detailed prices, but they are not inherently more accurate than higher timeframes. They simply provide a closer view of short-term market activity.
Ignoring the bigger picture
Focusing only on a single timeframe can make it more difficult to understand the broader market context. Price movements that appear significant on a lower timeframe may represent only a small part of a much larger trend.
Conclusion
Understanding trading timeframes is more than just choosing how much data appears on a chart. It is about recognizing that every chart offers a different perspective on the same market.
As traders become more familiar with viewing prices across different timeframes, they develop a stronger understanding of market context and how price movements unfold over time.
In the next lesson, we will explore the Dow Theory, one of the foundational concepts of technical analysis, and discover how trends develop and why they play such an important role in analyzing financial markets.